I am part of the PRIMUS, SDSS, and DECaLS collaborations, which has allowed me to study the universe out to a redshift of 4. You can find a current list of my publications on arXiv, and ADS, or download my resume [pdf] . Below I summarize a few results from my literature:
Mapping the WISE Sky in 3D
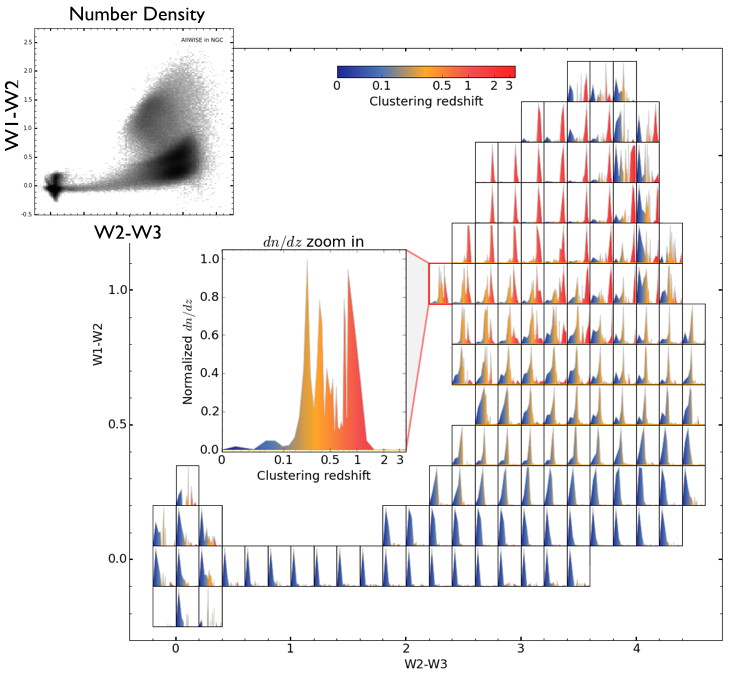
We discuss the clustering-based redshift estimation of obscured and unobscured AGN detected by the Wide-field Infrared Survey Explorer (WISE). The clustering redshift technique uses the data-driven method proposed by Menard et al. (2013) to derive the redshift distributions from measurements of spatial correlations without any assumption on spectral energy distributions. Applying this technique to the obscured AGN population will allow us to estimate the growth and environment of these objects with unprecedented accuracy and better understand this phase of AGNs.
The Clustering of X-ray, Radio, and IR-AGN
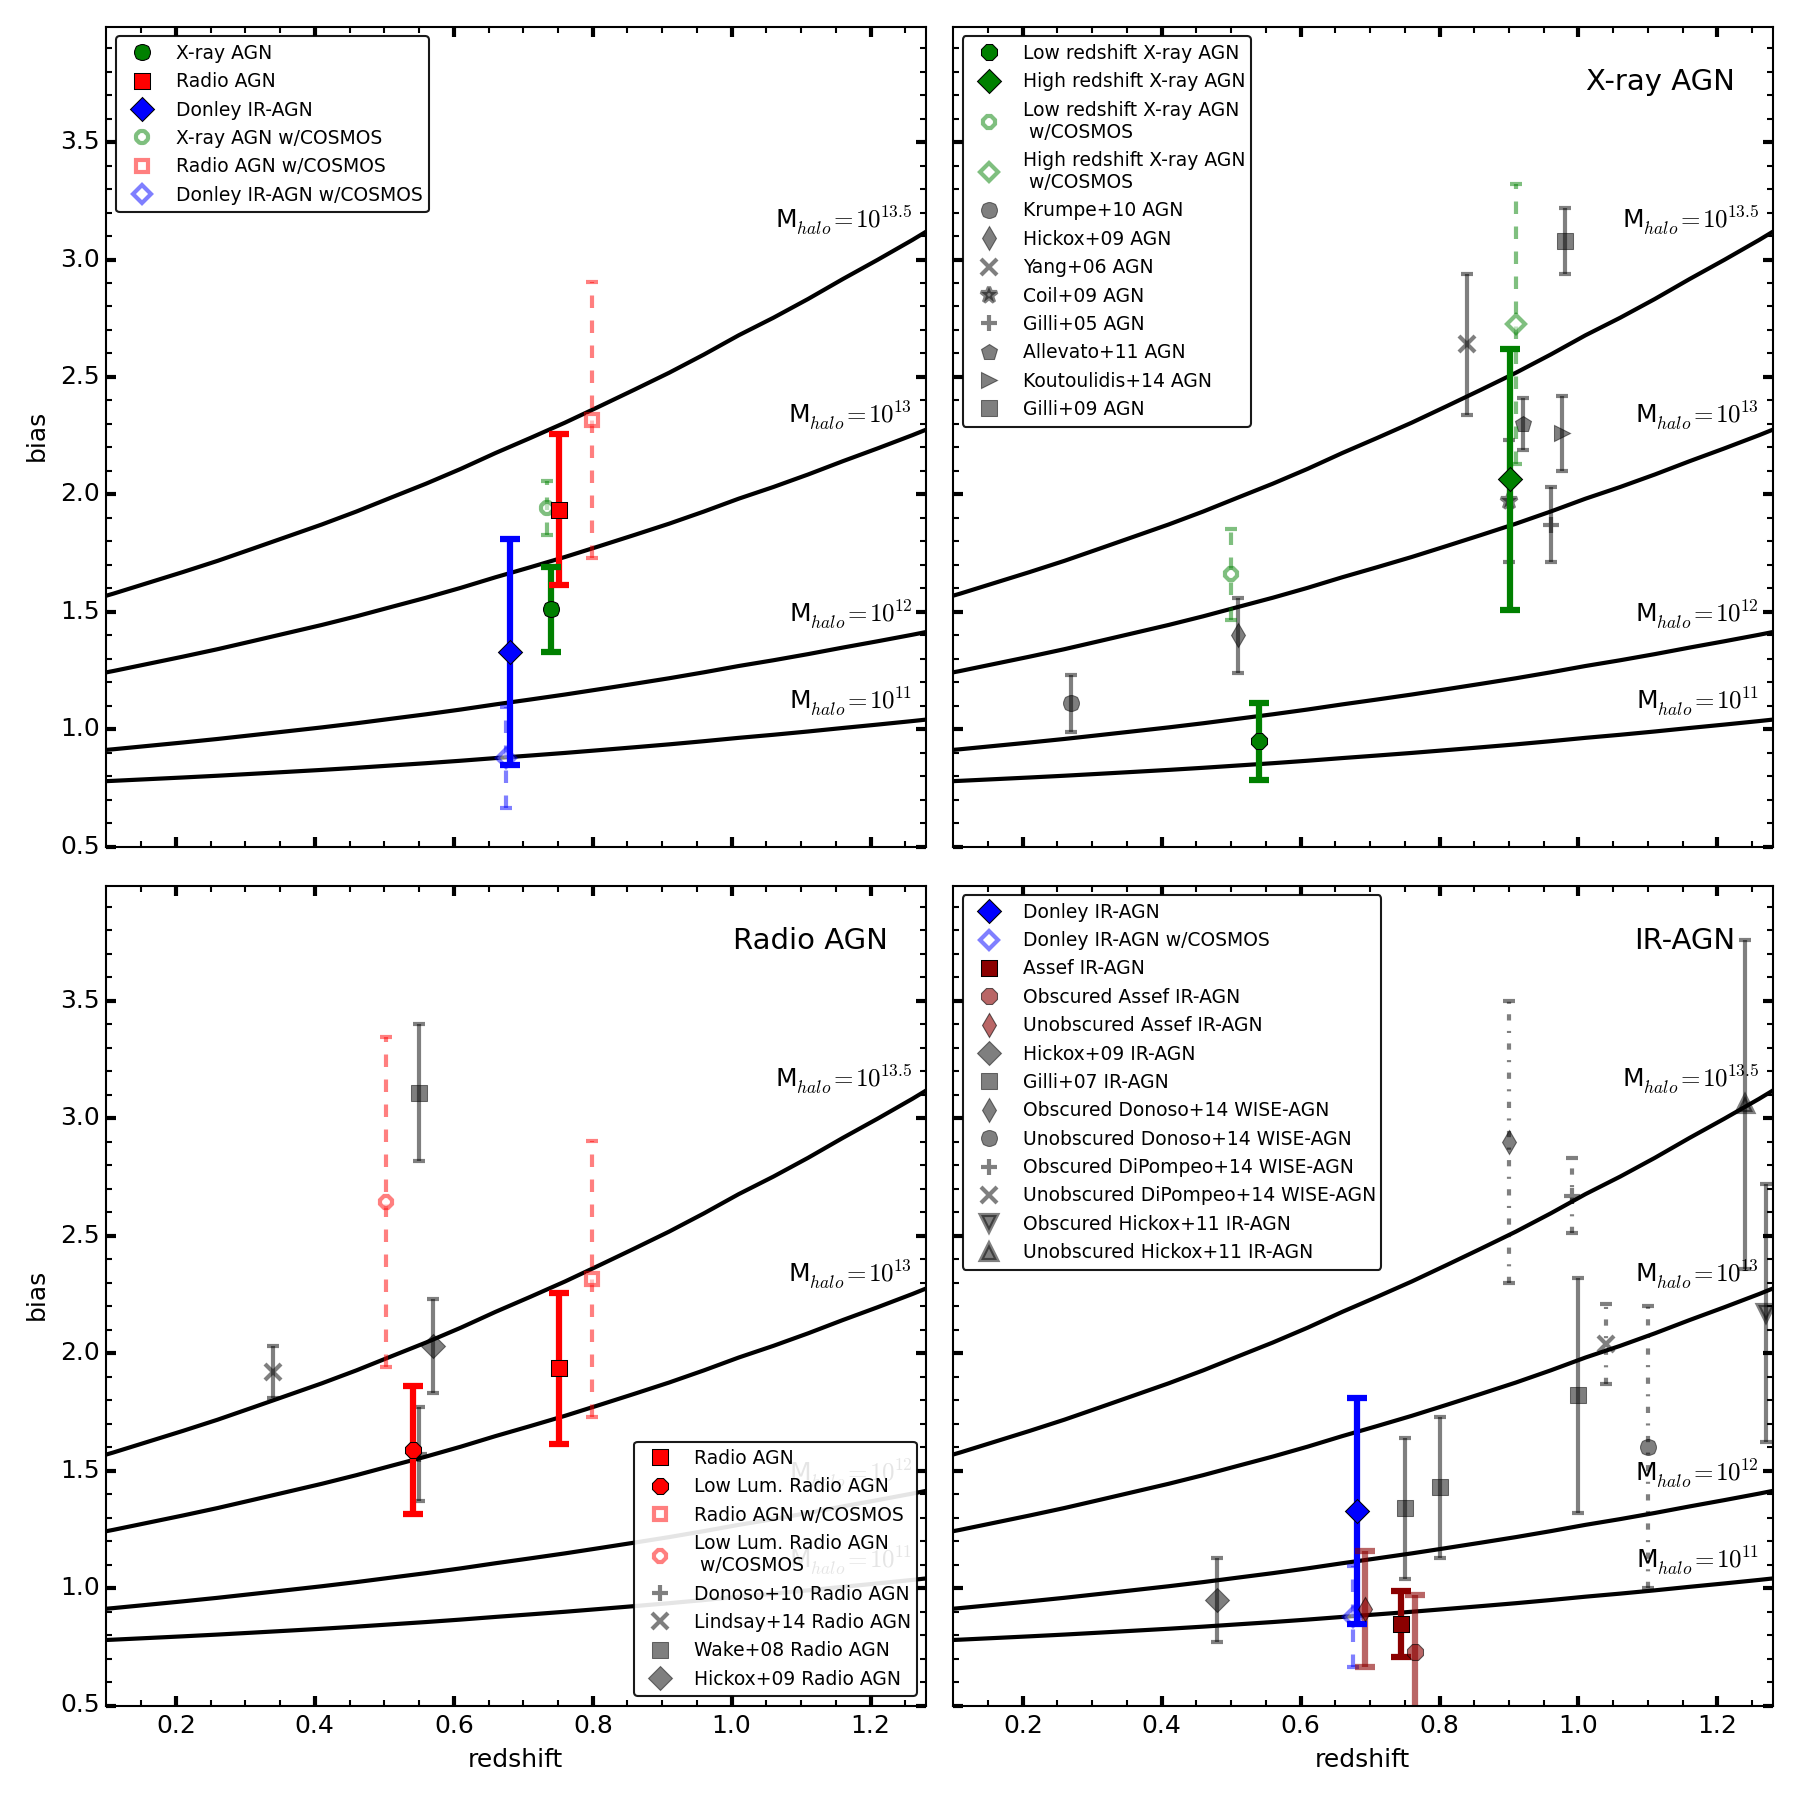
We measure the clustering of X-ray, radio, and mid-IR-selected active galactic nuclei (AGN) at 0.2 < z < 1.2 using multi-wavelength imaging and spectroscopic redshifts from the PRIMUS and DEEP2 redshift surveys, covering 7 separate fields spanning ~10 square degrees.
Using the cross-correlation of AGN with dense galaxy samples, we measure the clustering scale length and slope, as well as the bias, of AGN selected at different wavelengths.
Similar to previous studies, we find that X-ray and radio AGN are more clustered than mid-IR-selected AGN.
We further compare the clustering of each AGN sample with matched galaxy samples designed to have the same stellar mass, star formation rate, and redshift distributions as the AGN host galaxies and find no significant differences between their clustering properties.
The observed differences in the clustering of AGN selected at different wavelengths can therefore be explained by the clustering differences of their host populations, which have different distributions in both stellar mass and star formation rate.
Selection biases inherent in AGN selection, therefore, determine the clustering of observed AGN samples.
We further find no significant difference between the clustering of obscured and unobscured AGN, using IRAC or WISE colors or X-ray hardness ratio.
[arXiv]
IR and X-ray AGN Selection Techniques
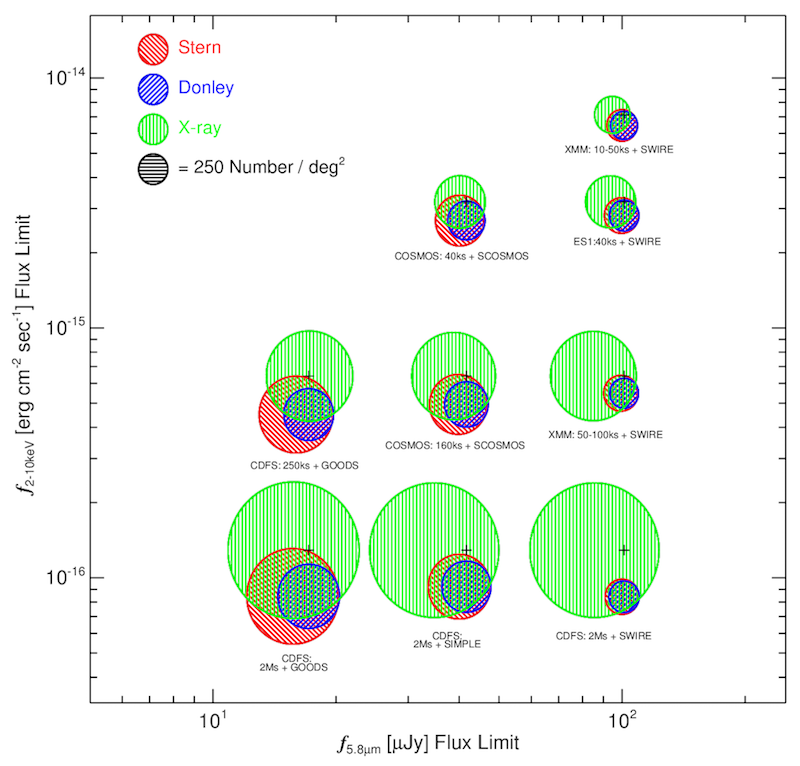
We present a study of Spitzer/IRAC and X-ray active galactic nuclei (AGNs) selection techniques in order to quantify the overlap, uniqueness, contamination, and completeness of each.
We investigate how the overlap and possible contamination of the samples depends on the IR and X-ray depths.
We use Spitzer/IRAC imaging, Chandra and XMM X-ray imaging, and PRism MUlti-object Survey (PRIMUS) spectroscopic redshifts to construct galaxy and AGN samples at 0.2 < z < 1.2 over 8 deg
[ads]
[arXiv]
Galaxy Morphology
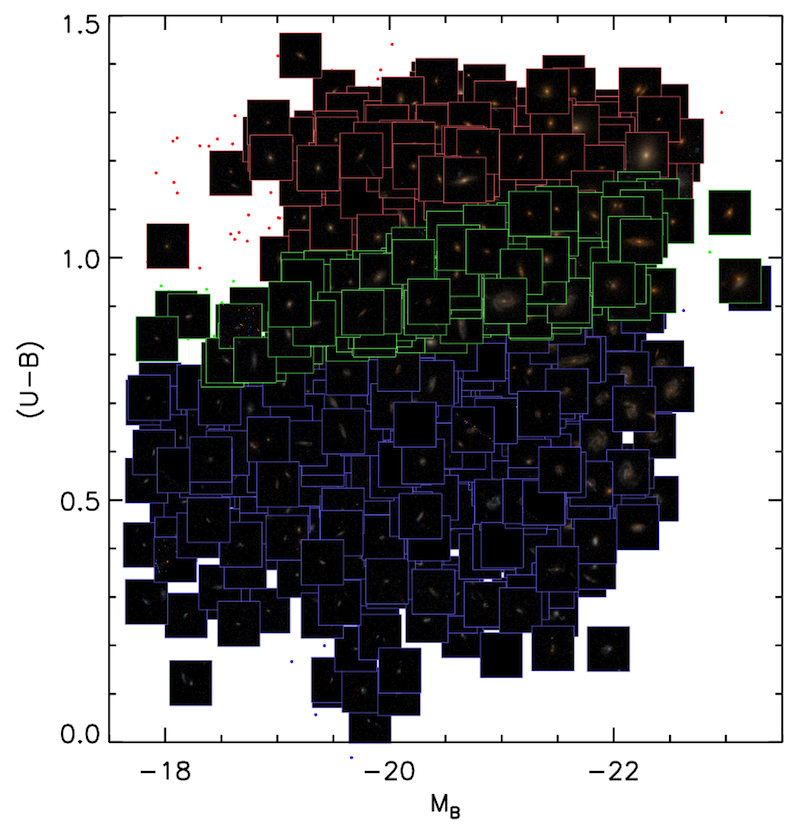
We present quantitative morphologies of ~300 galaxies in the optically defined green valley at 0.4 < z < 1.2, in order to constrain the mechanism(s) responsible for quenching star formation in the bulk of this population.
The sample is selected from galaxies in the All-Wavelength Extended Groth Strip International Survey (AEGIS).
While the green valley is defined using optical U - B colors, we find that using a green valley sample defined using NUV - R colors does not change the results.
Using Hubble Space Telescope/Advanced Camera for Surveys imaging, we study several quantitative morphological parameters including CAS, B/T from GIM2D, and Gini/M20.
We find that the green galaxy population is intermediate between the red and blue galaxy populations in terms of concentration, asymmetry, and morphological type and merger fraction estimated using Gini/M20.
We find that most green galaxies are not classified as mergers; in fact, the merger fraction in the green valley is lower than in the blue cloud.
We show that at a given stellar mass, green galaxies have higher concentration values than blue galaxies and lower concentration values than red galaxies.
Additionally, we find that 12% of green galaxies have B/T = 0 and 21% have B/T <= 0.05. Our results show that green galaxies are generally massive (M* ~ 10
[ads]
[arXiv]