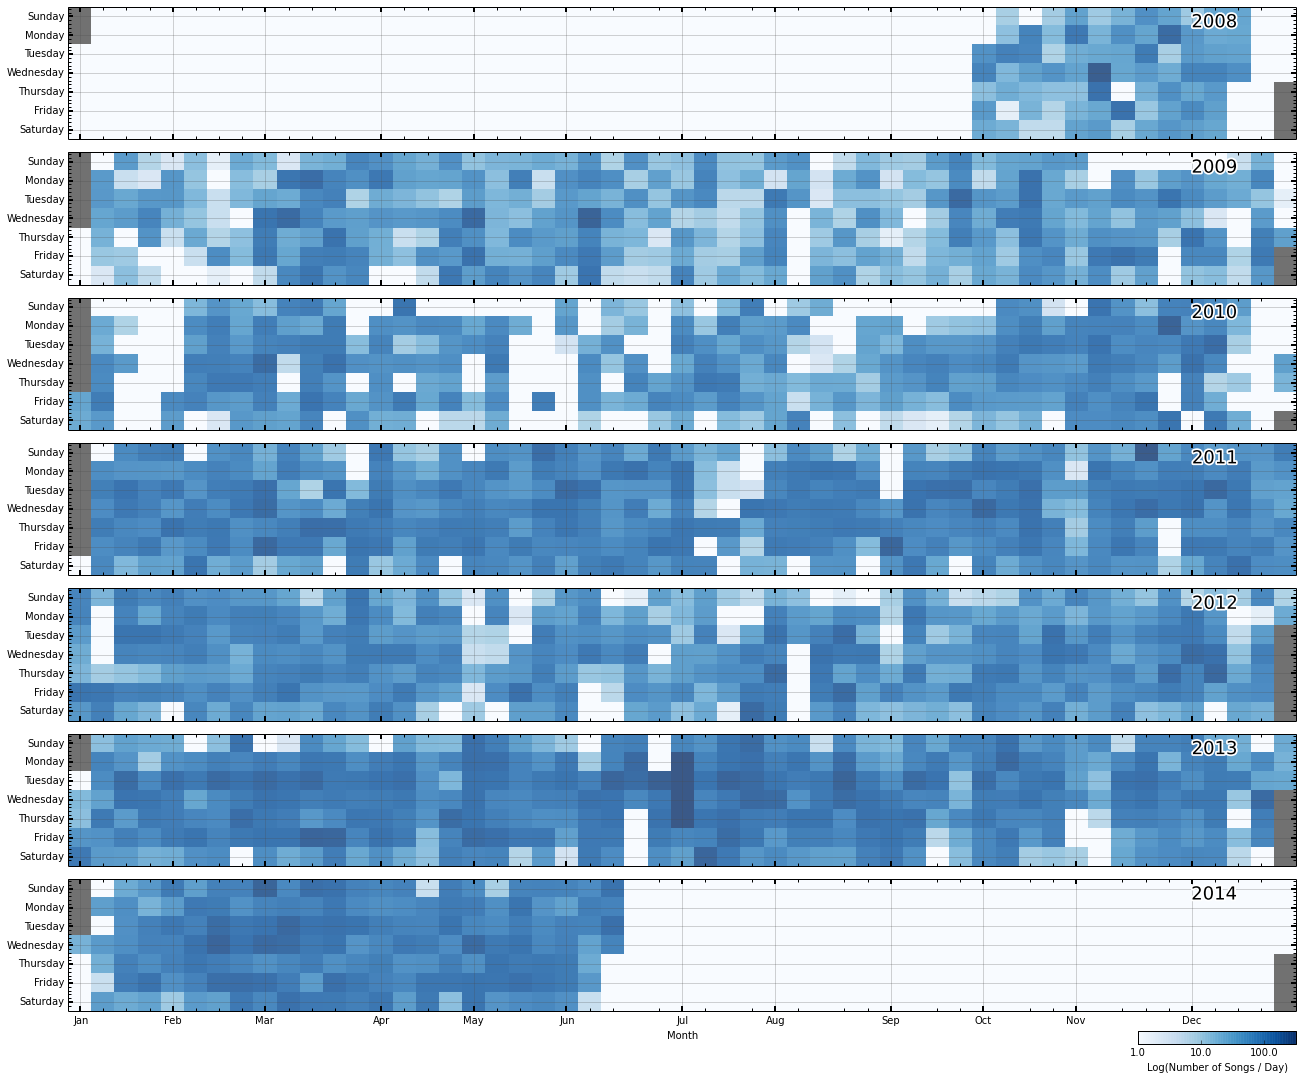
Somewhere between Firenze and the Testoroni apartment in Rome, I decided that I was going to keep a running record of my music. I was kicking this idea around a few months prior and started the GradStudentAlex account on Last.fm. At roughly 60 songs every day, I have scrobbled ~140K songs over the last ~6 years. There was an additional ~10k songs that I found in a MediaMonkey db backup. Some number of songs are missing due to uploading issues with an old ipod, and part of 2008 being eaten by MediaMonkey. However the above plot represents the vast majority of songs that have helped me get a PhD. Some interesting broad trends over the years:
- I listen to more music during the week than during the weekends. Some of this is due to biking and missing songs from the iPod.
- I listen to much more music in 2011 and 2013 while I wrote two papers, and in 2014 while I wrote my dissertation.
- I generally go camping for my holidays, so the majority of the blank days within each year are from these times.
- Overall I am listening to more music now than in 2008/2009.
Breaking this down into 10 minute chunks aligned on each day of the week highlights the daily changes in my music. I work a decent amount on Mondays which is reflected in the large number of songs that I listen to. Wednesday and Friday afternoons are dominated by Group meetings, seminars, and BASH, which limits the number of songs that I listen to. I get a decent amount of work, and thus songs listened to, between Journal club and BASH on Fridays. I generally get up later on weekends, and listen to less music. Period of low music highlight my sleep schedule, however I will discuss that further in another post.
From the most excellent The Echo Nest I can grab the valance of ~30% of the songs that I have listened to. Valance measures the “emotional content” of each song, where a valance of 1 is a happy song, and a valance of 0 is a miserable song. Originally I was hoping that I could use this to measure my mood through graduate school, however since the EchoNest database only has ~30% of my song archive I am not sure how reliable this is. Most of the songs that are missing are from 2011-2013 where my listening preference was dominated by mashups and not in the main db.
Above I show the weekly average of the valance with the scatter represented by the size and color of each point. Below I show the relative number of songs with Echo Nest data. Behind the points I show a fit trend line with trend uncertainty. Generally I am listening to lower valance music as I have progressed though graduate school. There is quite a dramatic shift in 2014 as started to work on finishing up my dissertation.
While graduate school is taxing, I think the larger emotional effect (over shorter timescales) that I expected to see is that of breakups that have happened in this period of my life. There was nothing statistically difference that I could separate using the valance. However after highlighting past breakups does suggest that my music preference changes afterwards.
I have some of the music that goes into this plot, so I should be able to submit valance numbers for the songs to the EchoNest DB. Also the collaboration between Spotify and EchoNest should hopefully net the rest of the songs in my archive. Also I have roughly three times as many plots in the iPython Notebook that need refinement and clean up to be posted here, so consider this just the tip of the iceberg.

